The FDA encourages the leveraging of Sentinel capability through the Innovation in Medical Evidence and Development Surveillance (IMEDS) program as a national resource for broader public health and medical evidence generation. The IMEDS Network can be leveraged for use in descriptive and inferential studies, including natural history, medication utilization, and comparative safety and effectiveness studies. For examples of current and recently completed post-market studies, please click here. The IMEDS team reviews all inquiries to assess whether the proposed research question addresses a safety concern of public health interest and whether IMEDS data are fit-for-purpose.

The IMEDS Distributed Network includes ten Network Partners (NPs), a subset of the Sentinel Distributed Data Network, that contribute the data and scientific expertise IMEDS leverages to conduct real-world evidence projects, including Post-Market Requirement (PMR) studies. The graphs below represent data from seven Network Partners spanning 2000 through the most recent data available as of July 2024. Data recency varied across Network Partners, with the most recent data ranging from December 2021 to April 2025.

If you have an idea for a research project, or are interested in learning how to leverage IMEDS as a resource for evidence generation, fill out this brief form to start the conversation.

Submit an Inquiry

To learn more about how the IMEDS Network can support your post-market or RWD research projects, please watch our Introduction to Innovation in Medical Evidence and Development Surveillance (IMEDS): The Research Resource webinar, view our policies and procedures, and/or contact us directly at IMEDS@reaganudall.org for more information.

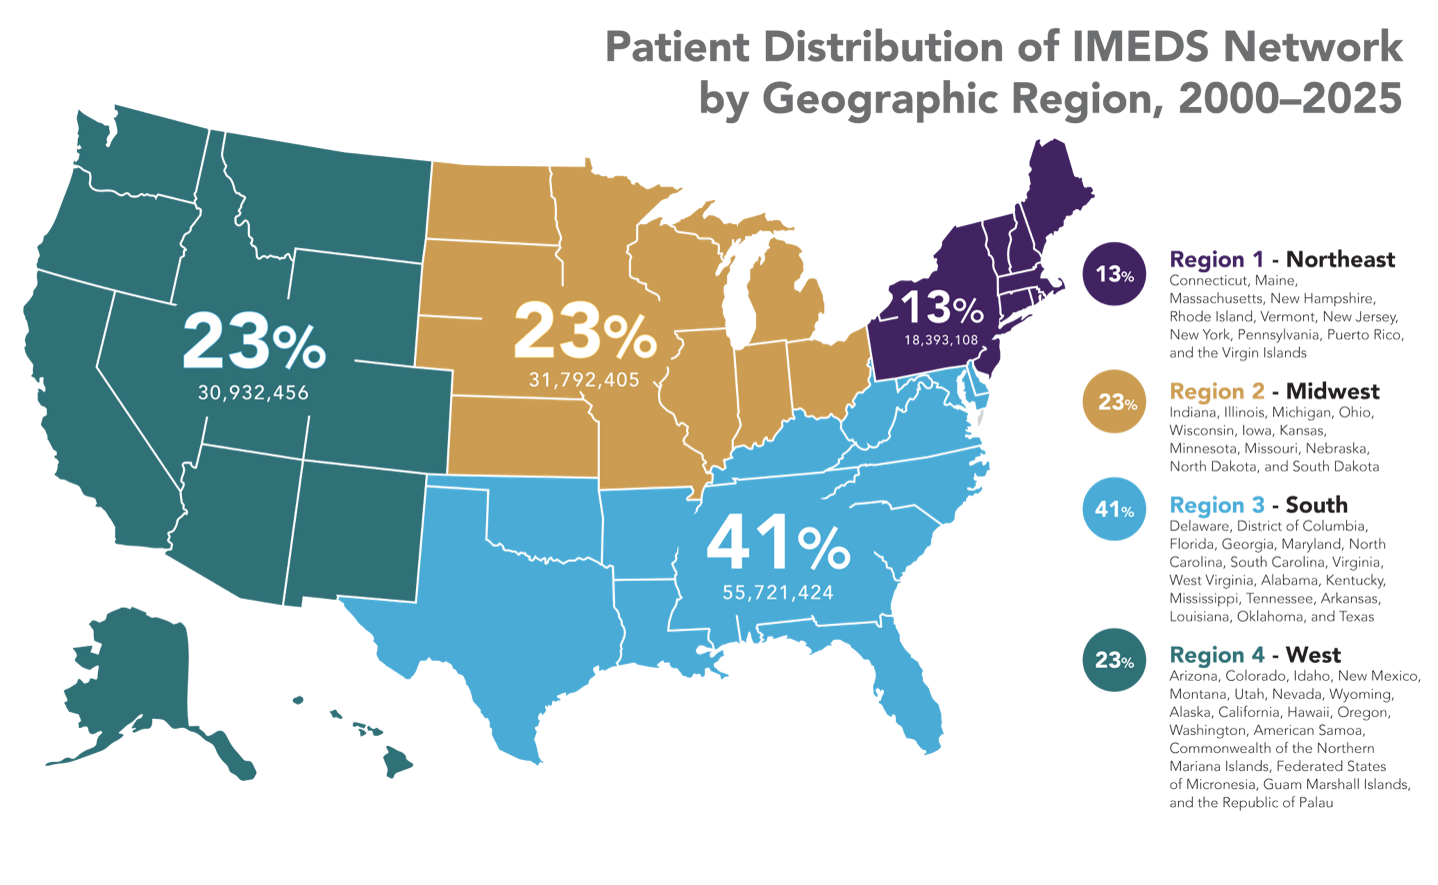
Patient Distribution of IMEDS Network by Geographic Region, 2025

This map shows the historic distribution of patients by geographic region from 2000-2025. Region is determined by their zip code on first day of their most recent enrollment span. Regions are based on the Health and Human Services (HHS) Region Descriptions. Data from Puerto Rico, Virgin Islands, American Samoa, Commonwealth of the Northern Mariana Islands, Federated States of Micronesia, Guam, Marshall Islands, and Republic of Palau are excluded from their respective HHS regions due to low cell counts.

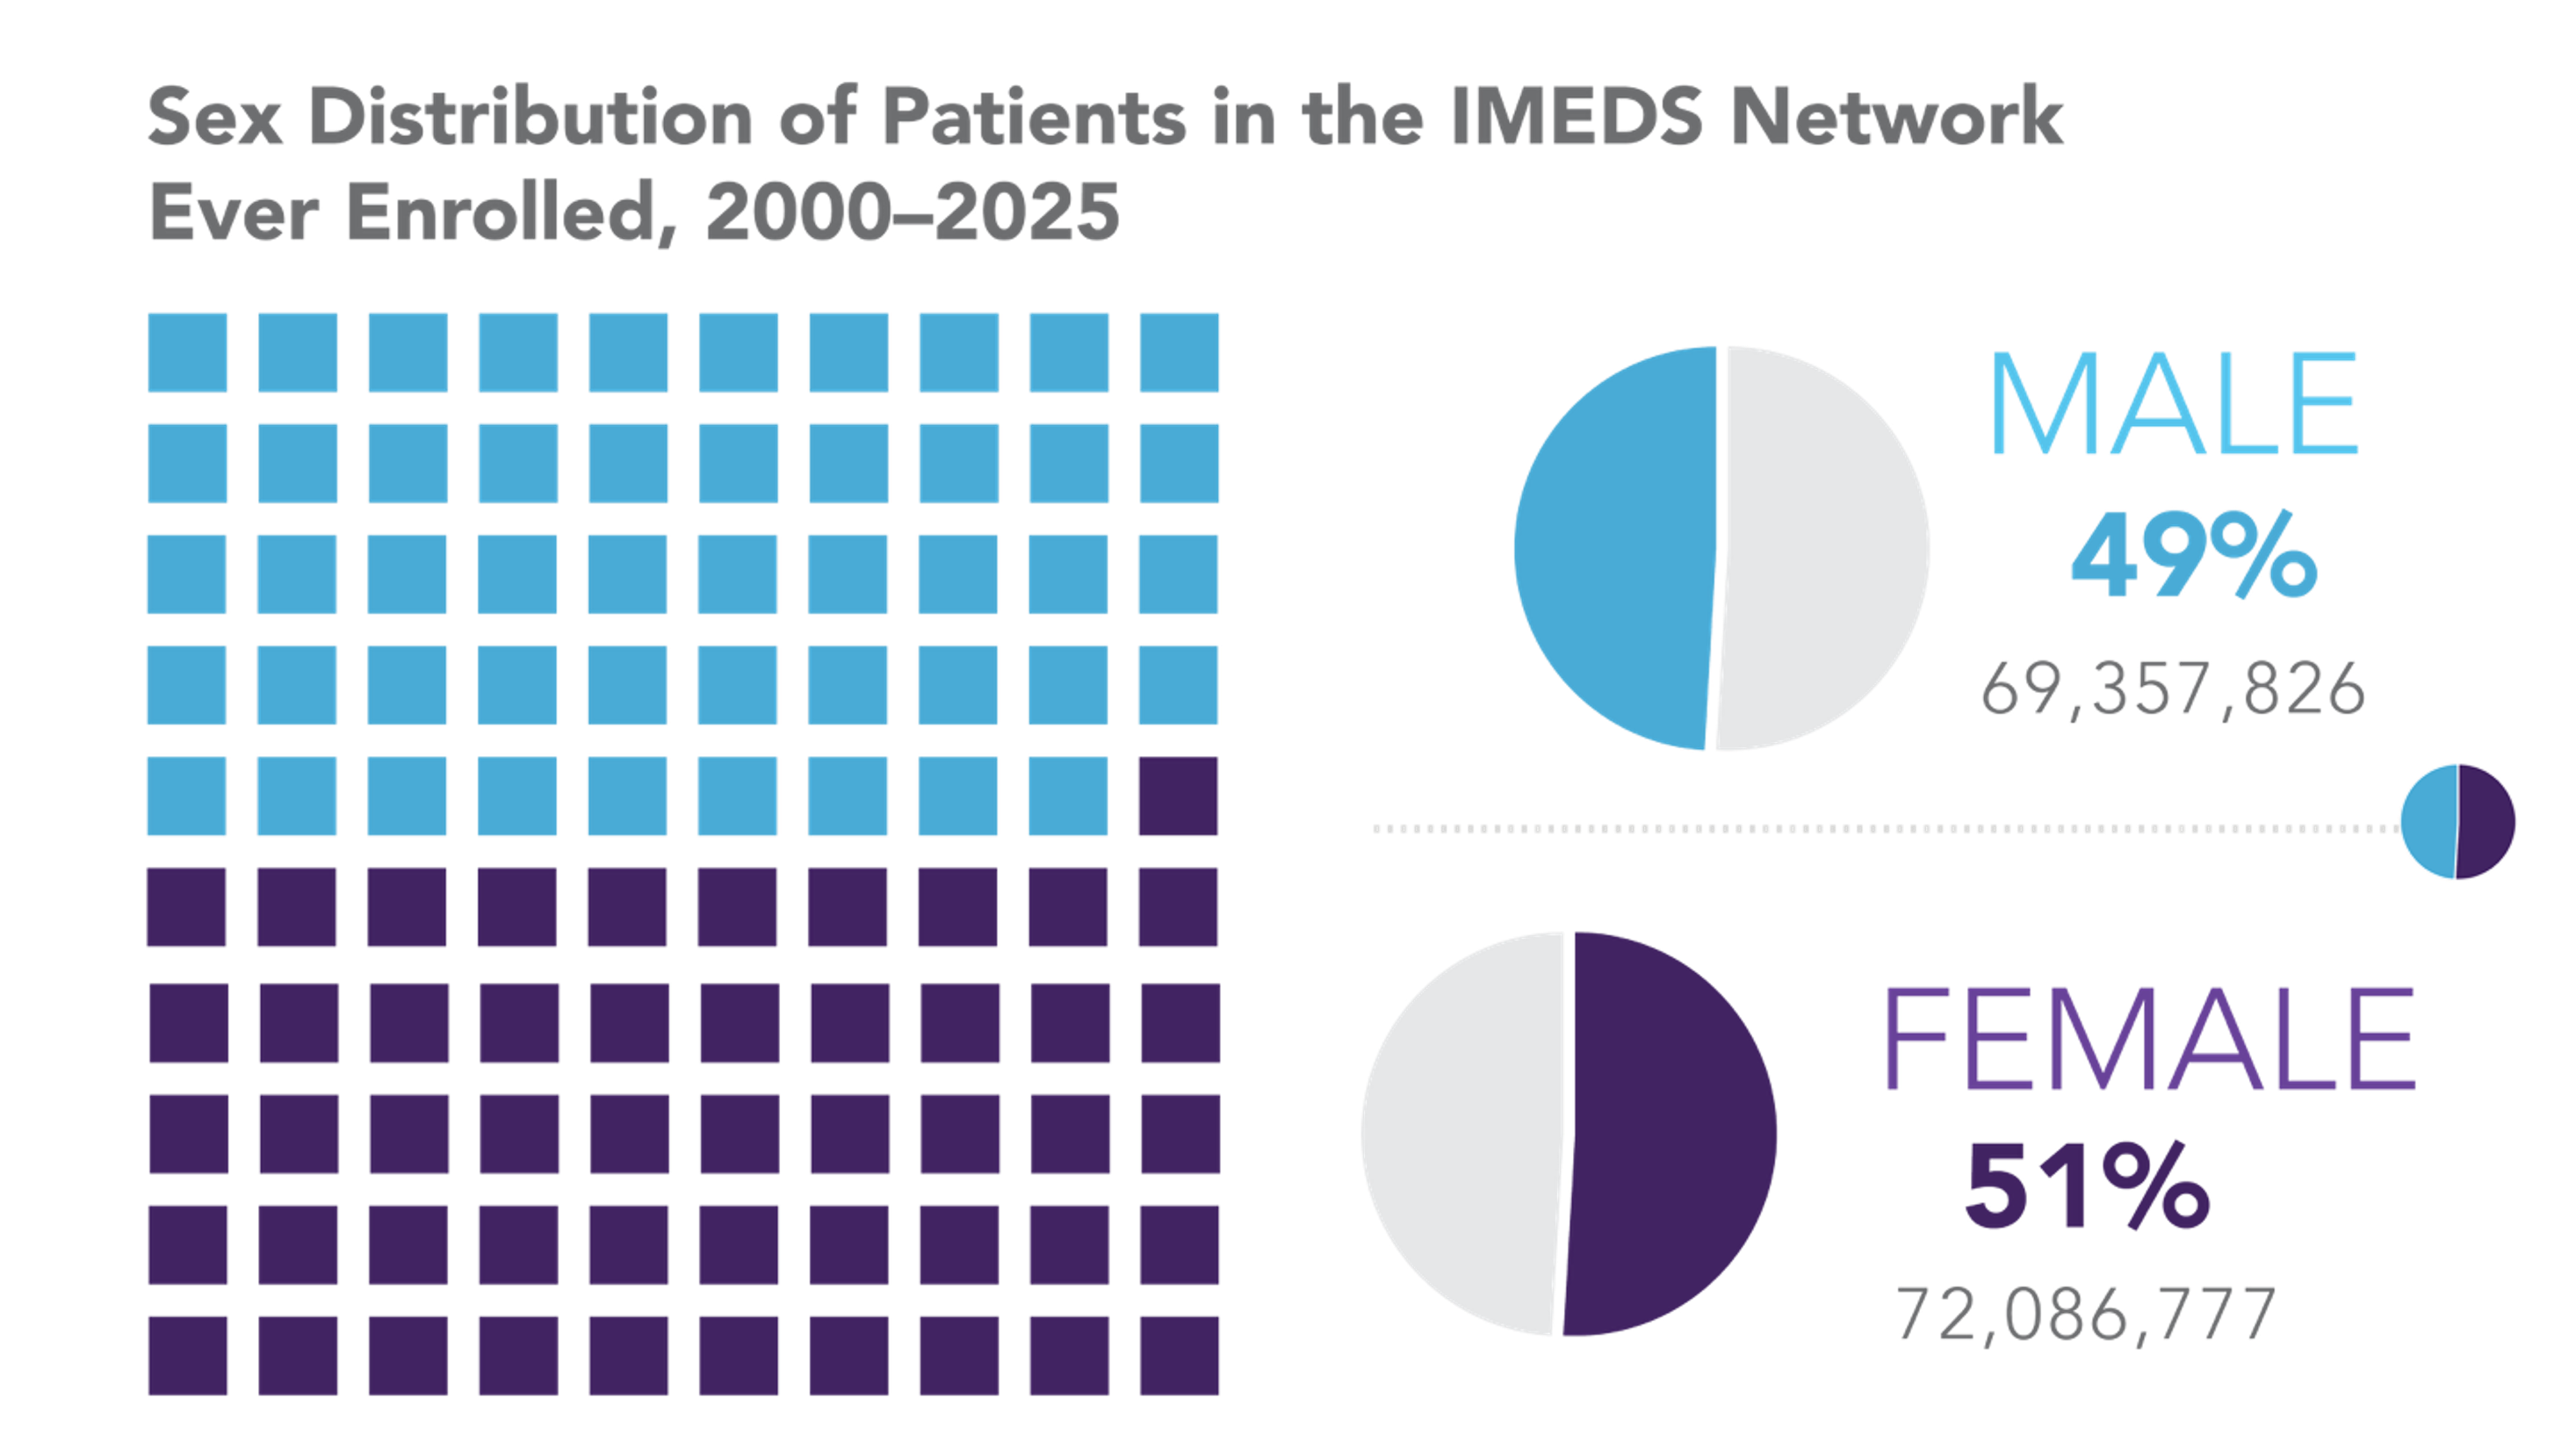
Sex Distribution of Patients in the IMEDS Network, 2025

This graph shows the historic distribution of sex in the IMEDS Network among those with medical and drug coverage in data pulled from 2000 to 2025.

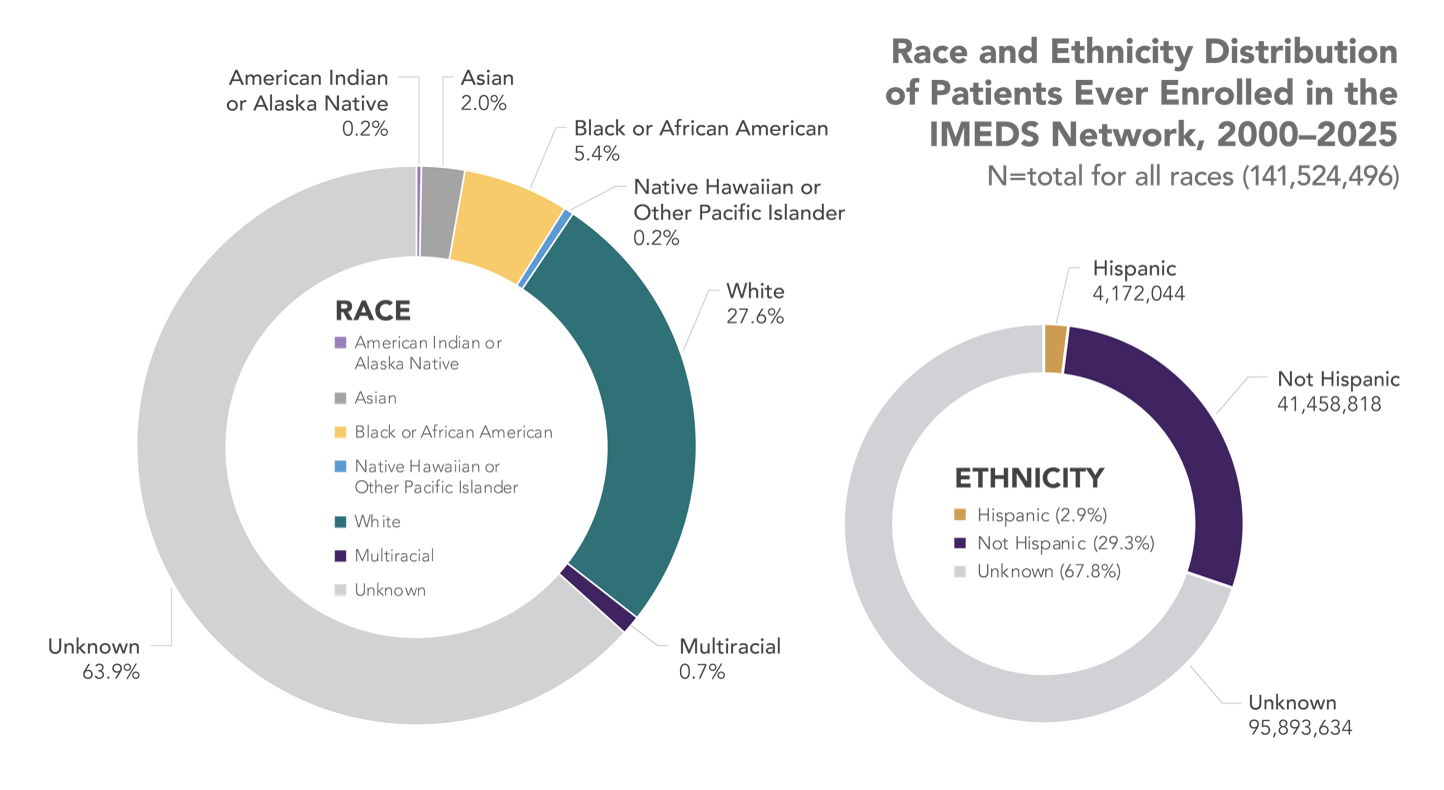
Race and Ethnicity Distribution of Patients in the IMEDS Network, 2025

Historic distribution of race and ethnicity for patients that have at least one span of medical and drug coverage in data pulled from 2000 to 2025.

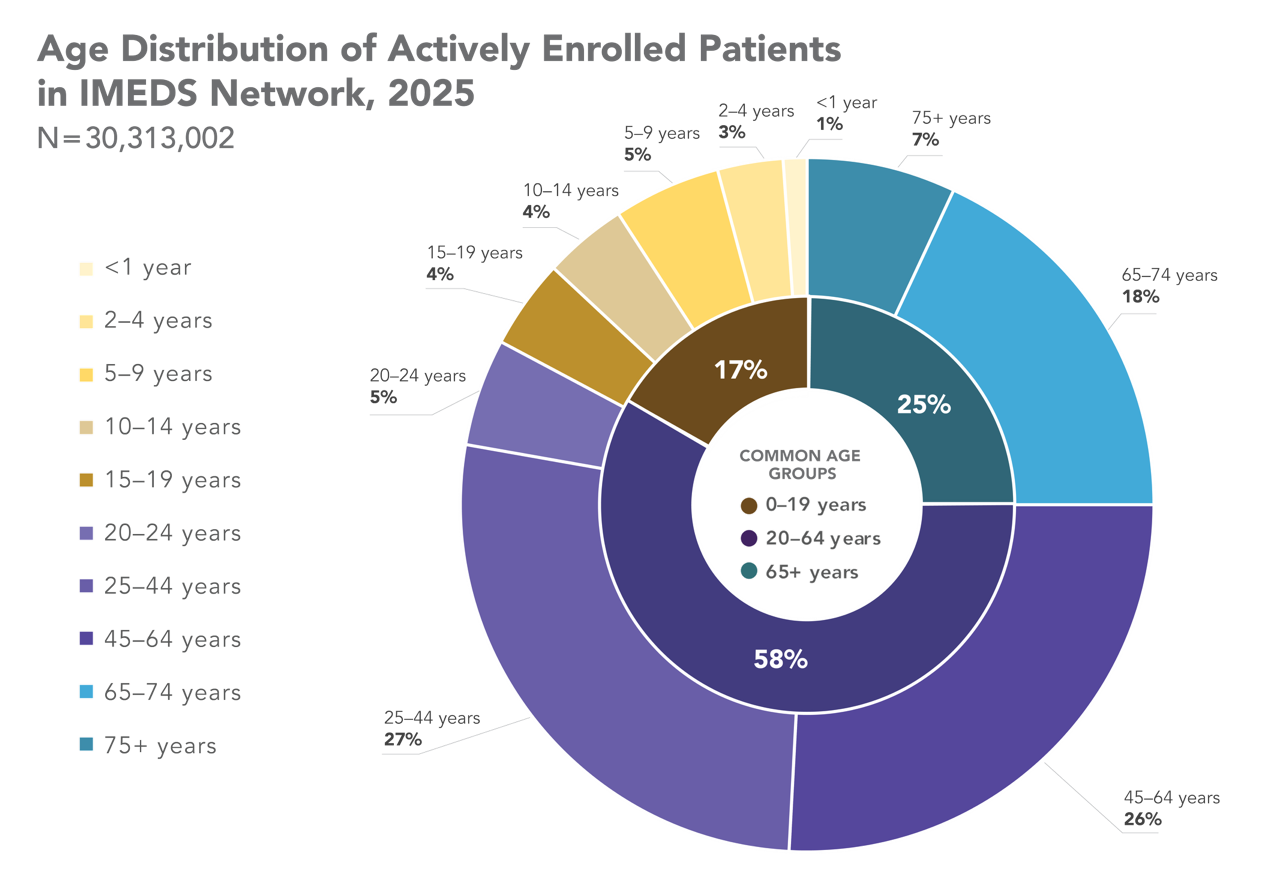
Age Distribution of Actively Enrolled Patients in IMEDS Network, 2025


Distribution of actively enrolled patients (as of the first day of their most recent enrollment span).

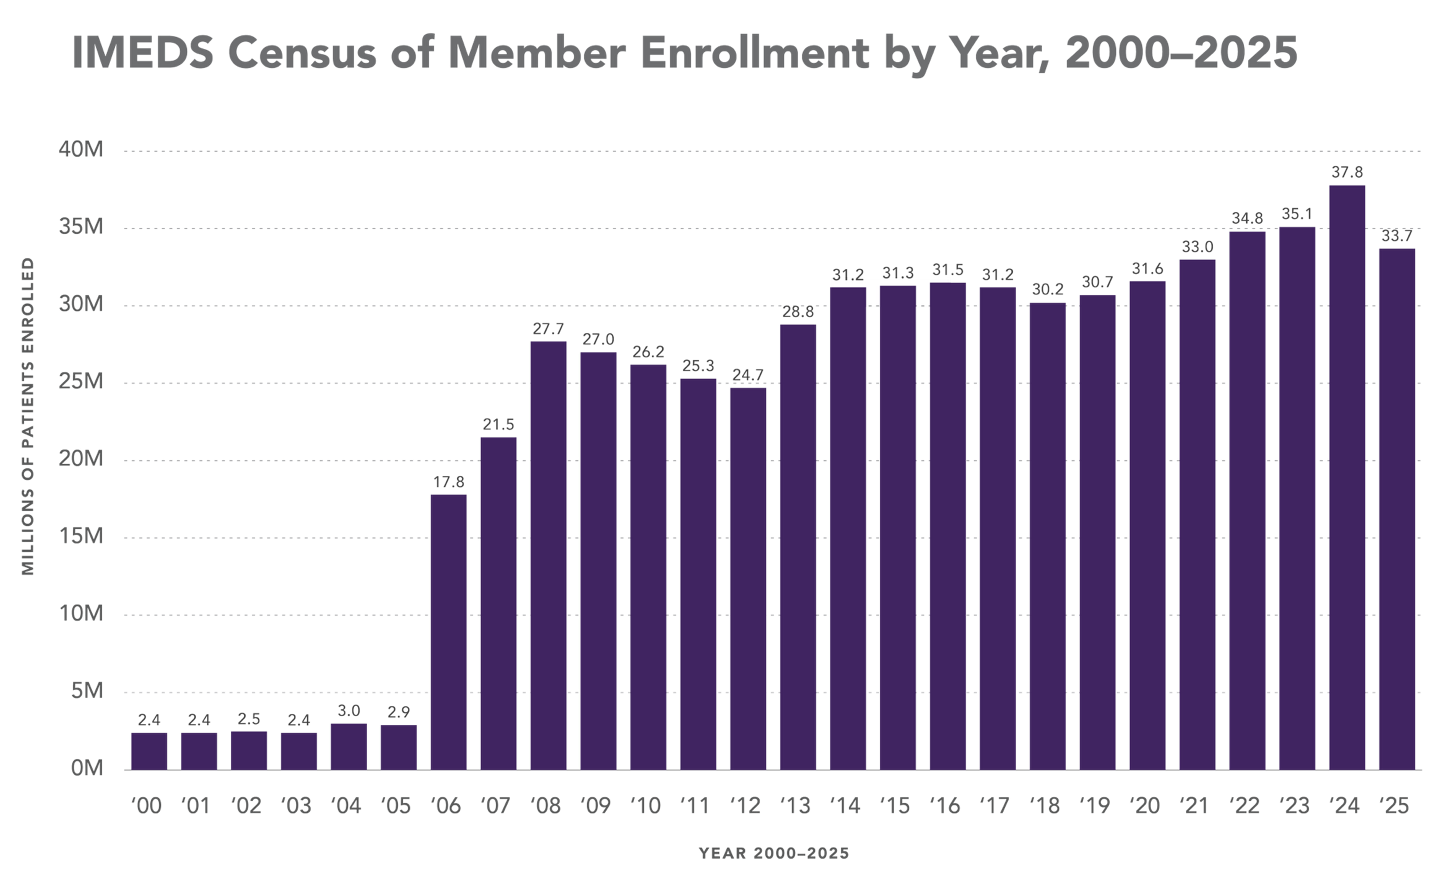
IMEDS Census, 2025

The number of patients enrolled in the IMEDS Distributed Database over time spans from 2000-2025. Patients are counted if they have at least one day of medical coverage and one day of drug coverage within that year. Data in 2025 and possibly 2024 are likely to be incomplete because of varying end dates.

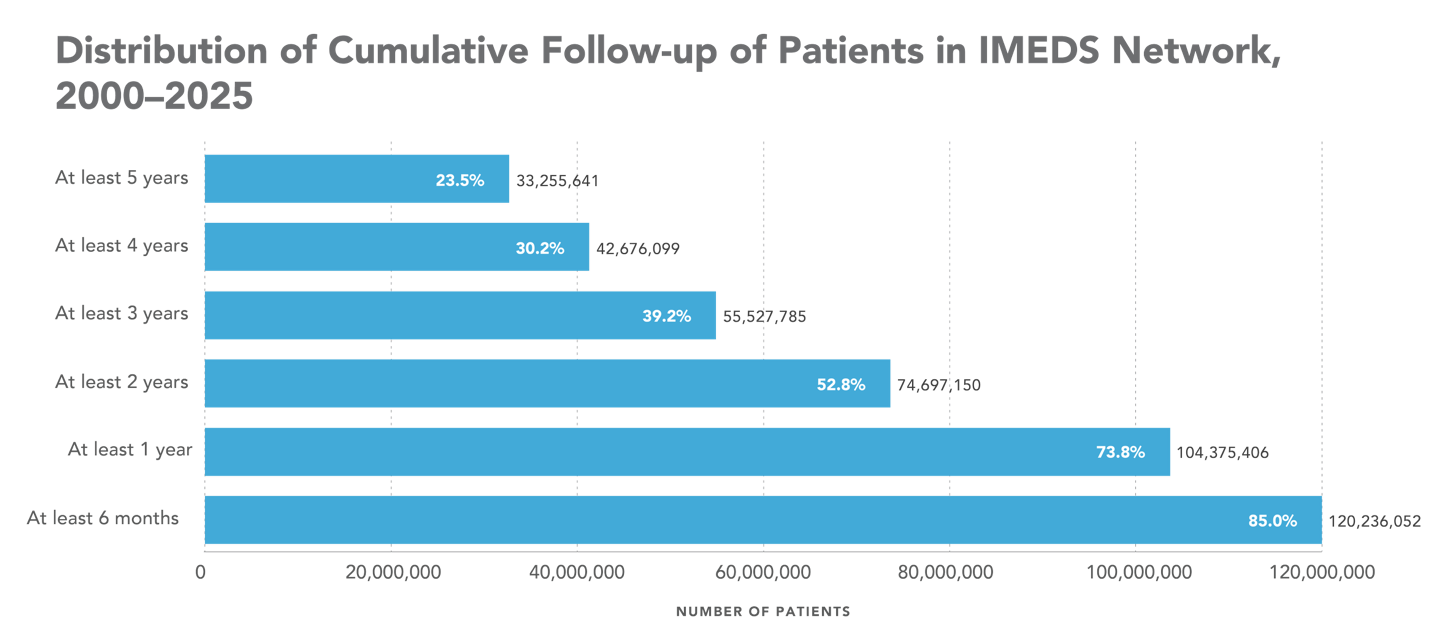
Distribution of Cumulative Follow-up, 2025

The distribution of cumulative enrollment with medical and drug coverage per patient within IMEDS Network covers over 120 million patients that have been enrolled for at least six months. An enrollment span is defined as having both medical and drug coverage. Cumulative enrollment is categorizing the total length of enrollment per patient, summing multiple enrollment spans if they exist. A single patient may contribute multiple enrollment spans to the IMEDS Network.

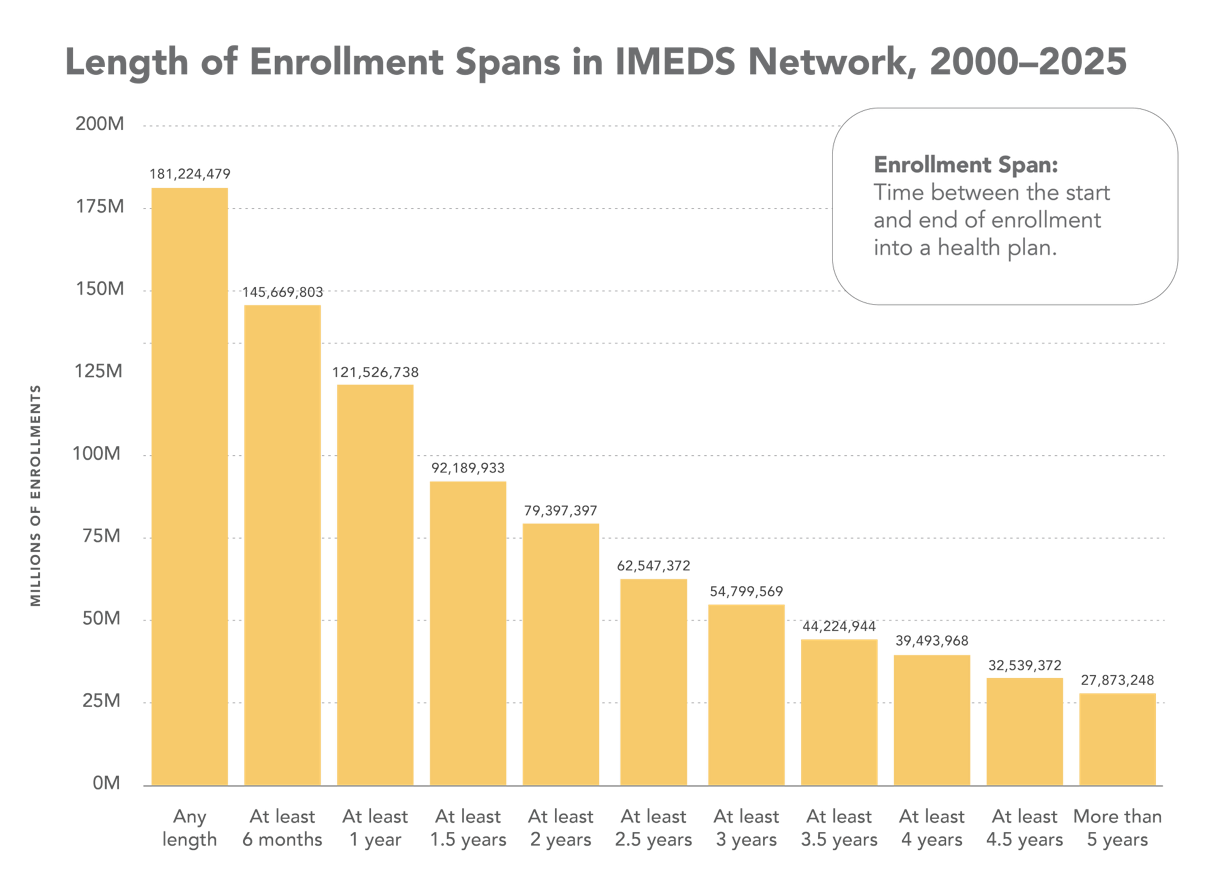
Length of Enrollment Spans in IMEDS Network, 2025

This graph shows the distribution of individual enrollment spans within the IMEDS Network. A single patient may contribute multiple enrollment spans to the IMEDS Network. Length of patient enrollment is categorizing the frequency of length of enrollment spans by enrollment record for patients with medical and drug coverage. An enrollment span is defined as having both medical and drug coverage. In this figure, gaps in coverage of less than 45 days are bridged into one enrollment span. The data visualization above shows 181.2M enrollment spans, which are derived from 141.5M patients.

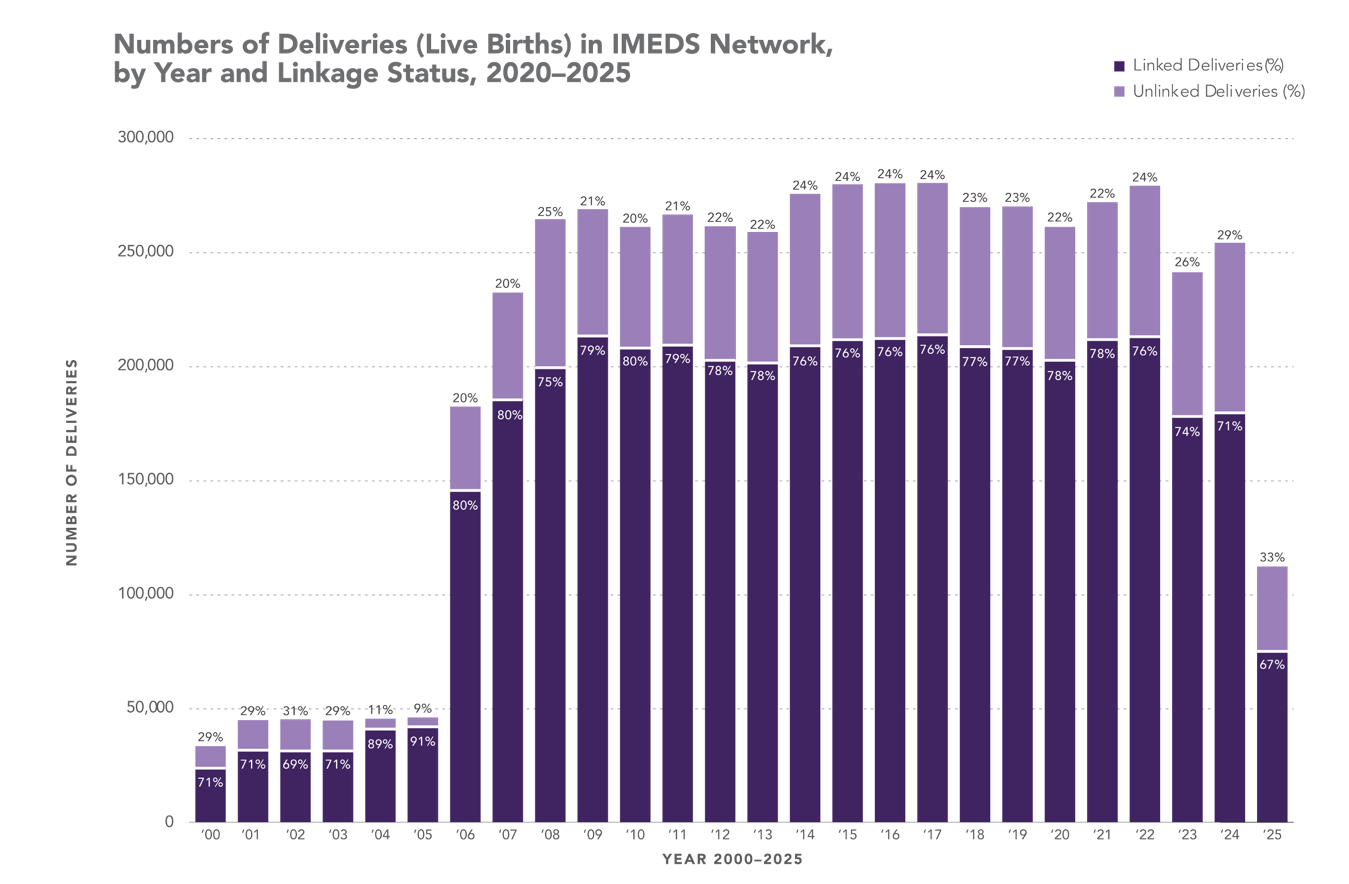
Number of Deliveries in IMEDS Network, 2025

Pregnancies in IMEDS are represented by linking the pregnancy outcome (live birth or non-live birth delivery) to the mother. This graph shows the distribution of linked and unlinked live-birth deliveries over time in data pulled from 2000-2025 across four IMEDS Network Partners that contribute to the Sentinel Mother-Infant Linkage table. The data reflects live births only. Data in 2025 and possibly 2024 are likely to be incomplete because of varying end dates.

Mothers and infants are matched mainly on family subscriber numbers and, when available, birth certificate data. Most matches were deterministic, though probabilistic matching methods were also used by some Network Partners.

Sentinel's algorithm for determining linkage with an infant requires an assignment of an infant patient identifier within the first year of life. Potential linkages are discarded if an infant patient identifier is not assigned within one year of the linkage date.

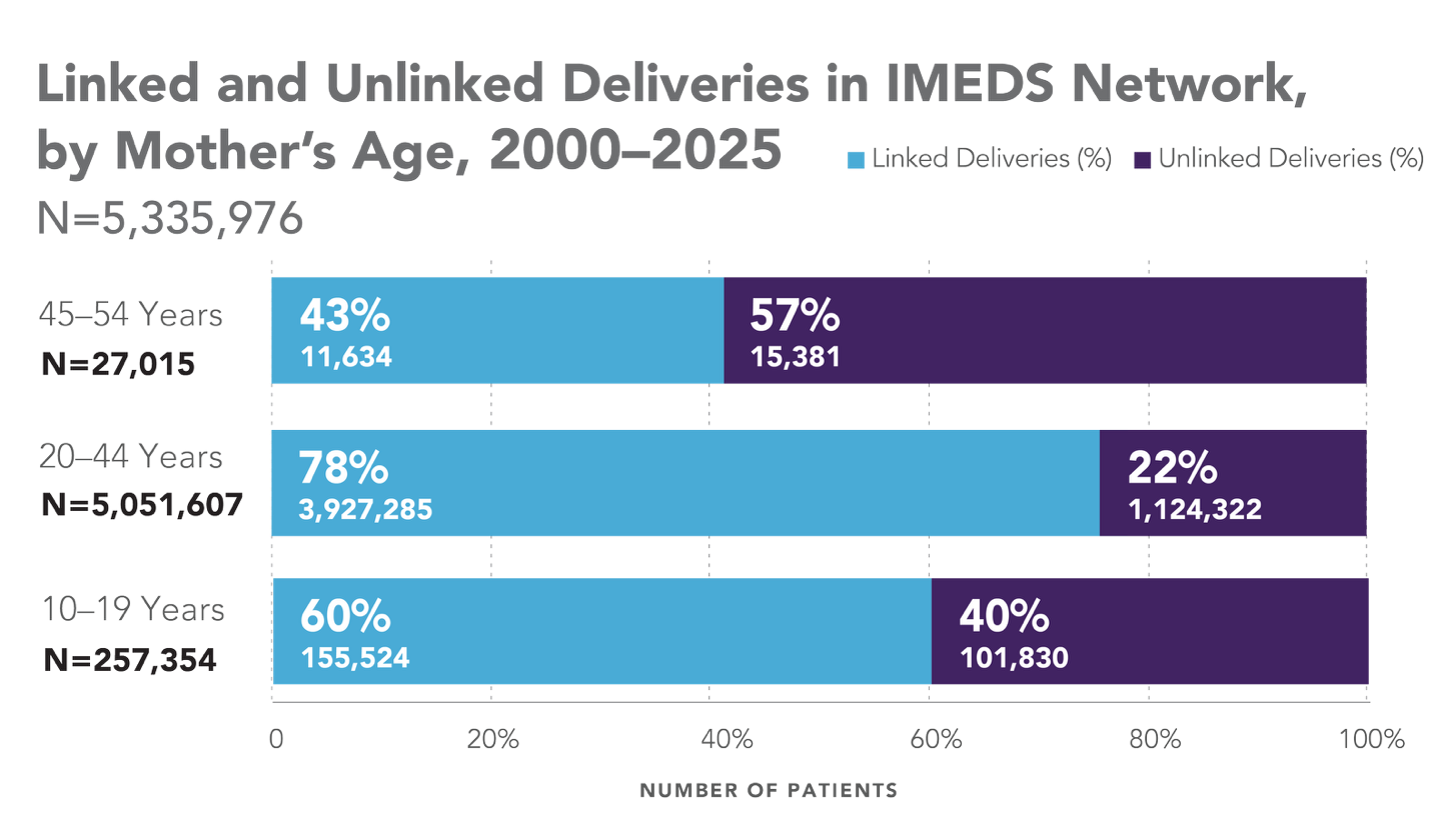
Linked and Unlinked Deliveries in IMEDS Network, 2025

This graph shows the distribution of linked and unlinked deliveries by mother's age group. The IMEDS Distributed Network contains 155,524 among 10-19-year-olds, 3.9 million among 20-44-year-olds, and around 11,634 linked deliveries among 45-54-year-olds across four IMEDS Network Partners. It is more common for mothers in the 45-54 age group to have different healthcare plans than their infants, leading to challenges in linkage. The data reflects live births only in data pulled from 2000-2025.